线性判别分析实战:花卉分类
本节我们将线性判别算法应用到花卉分类场景中。花卉分类指通过花卉不同的特征,如花瓣的长和宽、花蕊的长和宽,将花卉分为不同的类别。本节先将多维数据简化为二维数据,以便和理论知识部分相呼应。
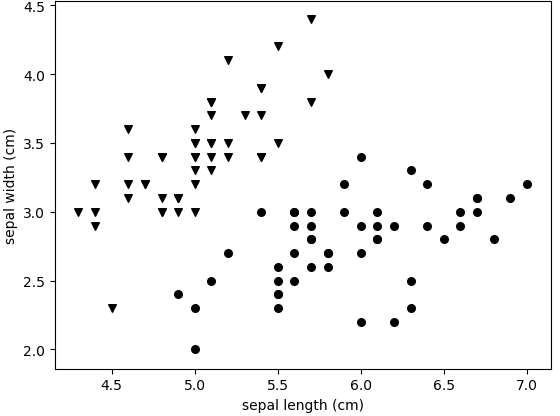
图1:作图结果
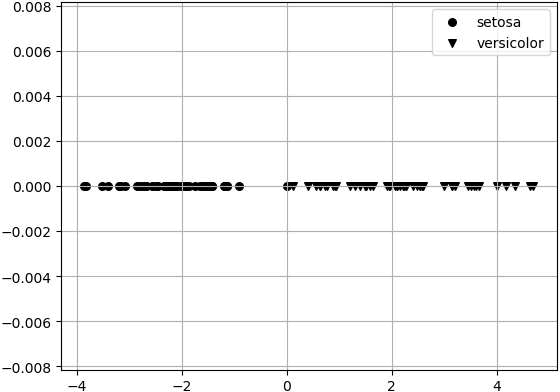
图2:作图结果
声明:《Python系列教程》为本站“54笨鸟”官方原创,由国家机构和地方版权局所签发的权威证书所保护。
1) 导入本项目所需要的模块
In [1]: import numpy as np
   ...: import matplotlib.pyplot as plt
   ...: from sklearn import datasets
   ...: from sklearn.discriminant_analysis import LinearDiscriminantAnalysis
   ...: from sklearn.model_selection import train_test_split
2) 导入数据集
In [2]: iris = datasets.load_iris()
3) 获取自变量数据
In [3]: X = iris['data']
4) 获取因变量数据
In [4]: y = iris['target']
5) 获取因变量名称
In [5]: target_names = iris['target_names']
6) 观察数据集
数据集如图 1 所示,这里只使用 sepal length 和 sepal width 两个属性。
In [11]: for m,i,target_name in zip('vo^',range(2),target_names[0:2]):
    ...:     sl = X[y == i,0]  # sl = sepal length (cm)
    ...:     sw = X[y == i,1]  # sw = sepal width (cm)
    ...:     plt.scatter(sl,sw,marker=m,label=target_name,s=30,c='k')
    ...:
    ...: plt.xlabel('sepal length (cm)')  # 绘制x轴和y轴标签名
    ...: plt.ylabel('sepal width (cm)')
    ...: plt.show()
图1:作图结果
7) 关闭作图窗口
In [7]: plt.close()
8) 获取数据
获取 sepal length 和 sepal width 两个属性的自变量矩阵;获取 sepal length 和 sepal width 两个属性的因变量矩阵。
In [8]: X=X[(y==1) | (y==0),0:2]
    ...: y=y[(y==1) | (y==0)]
9) 创建模型变量
通过 n_components 参数设置压缩之后的维度为 1。In [9]: lda = LinearDiscriminantAnalysis(n_components=1)
10) 训练数据
In [10]: ld = lda.fit(X,y)
11) 将模型应用到原矩阵上
这一步实际上就是通过模型进行降维。In [11]: X_t =ld.transform(X)
12) 转换y的结构
因为压缩到 1 维,所以y轴坐标全部为 0。In [12]: y_t = np.zeros(X_t.shape)
13) 作压缩后的图像
结果如图 2 所示。
In [13]: for m,i,target_name in zip('ov^',range(2),target_names[0:2]):  # 做压缩后
#的图像
    ...:     plt.scatter(X_t[y == i],y_t[y == i],marker=m,label=target_name,s=30, c='k')
    ...:
    ...: plt.legend()
    ...: plt.show()
图2:作图结果
14) 关闭作图窗口
In [14]: plt.close()
15) 分割训练集和测试集
这里取 80% 作为训练集,20% 作为测试集。In [15]: X_train,X_test,y_train,y_test = train_test_split(X,y,test_size=0.2)
16) 创建线性判别对象
In [16]: lda = LinearDiscriminantAnalysis(n_components=1)
17) 训练模型
In [17]: ld = lda.fit(X_train,y_train)
18) 模型预测
In [18]: pre = ld.predict(X_test)
19) 查看预测结果
In [19]: list(zip(pre,y_test,pre==y_test))
Out[19]:
[(0, 0, True),
(0, 0, True),
(1, 1, True),
(1, 1, True),
(1, 1, True),
(0, 0, True),
(0, 0, True),
(1, 1, True),
(1, 1, True),
(1, 1, True),
(1, 1, True),
(1, 1, True),
(1, 1, True),
(0, 0, True),
(0, 0, True),
(1, 1, True),
(0, 0, True),
(0, 0, True),
(1, 1, True),
(1, 1, True)]
20) 查看准确率
In [20]: ld.score(X_test,y_test)
Out[20]: 1.0
声明:《Python系列教程》为本站“54笨鸟”官方原创,由国家机构和地方版权局所签发的权威证书所保护。
 ICP备案:
 公安联网备案: