逻辑回归算法实战:二维鸢尾花分类
本节我们将逻辑回归算法应用到鸢尾花数据集上,看其分类效果。

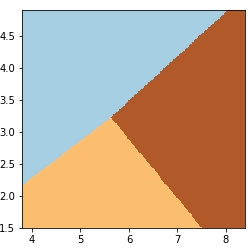
图1:效果图

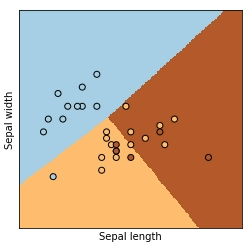
图2:效果图
声明:《Python系列教程》为本站“54笨鸟”官方原创,由国家机构和地方版权局所签发的权威证书所保护。
1) 导入的模块
这里我们用到了 Numpy 来提取数据,使用 Matplotlib 做最终的展示,使用 Scikit 中的 iris 作为数据集,导入线性模块 linear_model。使用 sklearn.model_selection进行测试集和训练集的划分。In [1]: import numpy as np ...: import matplotlib.pyplot as plt ...: from sklearn import linear_model, datasets ...: from sklearn.model_selection import train_test_split
2) 导入必要的数据
In [2]: iris = datasets.load_iris() # 导入相关数据
3) 获取相应的属性
这里我们取 iris 数据集中的前两个属性。
In [3]: X = iris.data[:, :2]  # 我们只使用前两个属性
   ...: X
Out[3]:
array([[5.1, 3.5],
       [4.9, 3],
       [4.7, 3.2],
       [4.6, 3.1],
       [5. , 3.6],
       [5.4, 3.9],
       [4.6, 3.4],
       ......
       [6.8, 3.2],
       [6.7, 3.3],
       [6.7, 3],
       [6.3, 2.5],
       [6.5, 3],
       [6.2, 3.4],
       [5.9, 3]])
4) 获得目标变量
In [4]: y = iris.target # 获得目标变量
5) 分割训练集和测试集
train_test_split() 方法的第 1 个参数传入的是属性矩阵,第 2 个参数是目标变量,第 3 个参数是测试集所占的比重。它返回了 4 个值,按顺序分别是训练集属性、测试集属性、训练集目标变量、测试集目标变量。In [5]: X_train, X_test, y_train, y_test = train_test_split(X, y, test_size=0.2) #分割训练集和测试集
6) 设置网格步长
为了接下来的作图做准备。In [6]: h = .02 # 设置网格的步长
7) 创建模型对象
In [7]: logreg = linear_model.LogisticRegression(C=1e5) #创建模型对象
8) 训练模型对象
In [8]: logreg.fit(X_train,  y_train)  # 训练
Out[8]:
LogisticRegression(C=100000.0, class_weight=None, dual=False,
          fit_intercept=True, intercept_scaling=1, max_iter=100,
          multi_class='ovr', n_jobs=1, penalty='l2', random_state=None,
          solver='liblinear', tol=0.0001, verbose=0, warm_start=False)
9) 为作图准备
分别设置第 1 维度的网格数据和第 2 维度的网格数据。In [9]: x_min, x_max = X[:, 0].min() -.5, X[:, 0].max() + .5 # 第1维度网格数据预备 ...: y_min, y_max = X[:, 1].min() -.5, X[:, 1].max() + .5 # 第2维度网格数据预备
10) 做面积图
创建网格数据,“xx,yy”是一个网格类型,主要是为了作面积图。In [10]: xx, yy = np.meshgrid(np.arange(x_min, x_max, h), np.arange(y_min, y_max,h)) # 创建网格数据
11) 预测模型
In [11]: Z = logreg.predict(np.c_[xx.ravel(), yy.ravel()]) # 预测
12) 将预测结果做与“xx,yy”数据结构相同的处理
In [12]: Z = Z.reshape(xx.shape) # 将 Z 矩阵转换为与 xx 相同的形状
13) 绘制图像
绘制模型分类器的结果图像。
In [13]: plt.figure(figsize=(4, 4))  # 设置画板
    ...: plt.pcolormesh(xx, yy, Z, cmap=plt.cm.Paired)  # 作网格图
Out[13]: <matplotlib.collections.QuadMesh at 0xae38cc0>
效果如图 1 所示。
图1:效果图
14) 绘制图像
绘制模型图像以及样本点的图像。
In [14]: plt.figure(figsize=(4, 4))  # 设置画板
    ...: plt.pcolormesh(xx, yy, Z, cmap=plt.cm.Paired)  # 作网格图
    ...: plt.scatter(X_test[:, 0], X_test[:, 1], c=y_test, edgecolors='k', cmap= plt.cm.Paired)  # 画出预测的结果
    ...:
    ...: plt.xlabel('Sepal length')  # 作x轴标签
    ...: plt.ylabel('Sepal width')  # 作y轴标签
    ...: plt.xlim(xx.min(), xx.max())  # 设置x轴范围
    ...: plt.ylim(yy.min(), yy.max())  # 设置y轴范围
    ...: plt.xticks(())  # 隐藏x轴刻度
    ...: plt.yticks(())  # 隐藏y轴刻度
效果如图 2 所示。
图2:效果图
声明:《Python系列教程》为本站“54笨鸟”官方原创,由国家机构和地方版权局所签发的权威证书所保护。
 ICP备案:
 公安联网备案: